Sales Data Analysis & Business Intelligence
An 800-order Kenyan retail dataset analysed in Excel to organise performance measures and surface useful trends.
Excel analysis complete
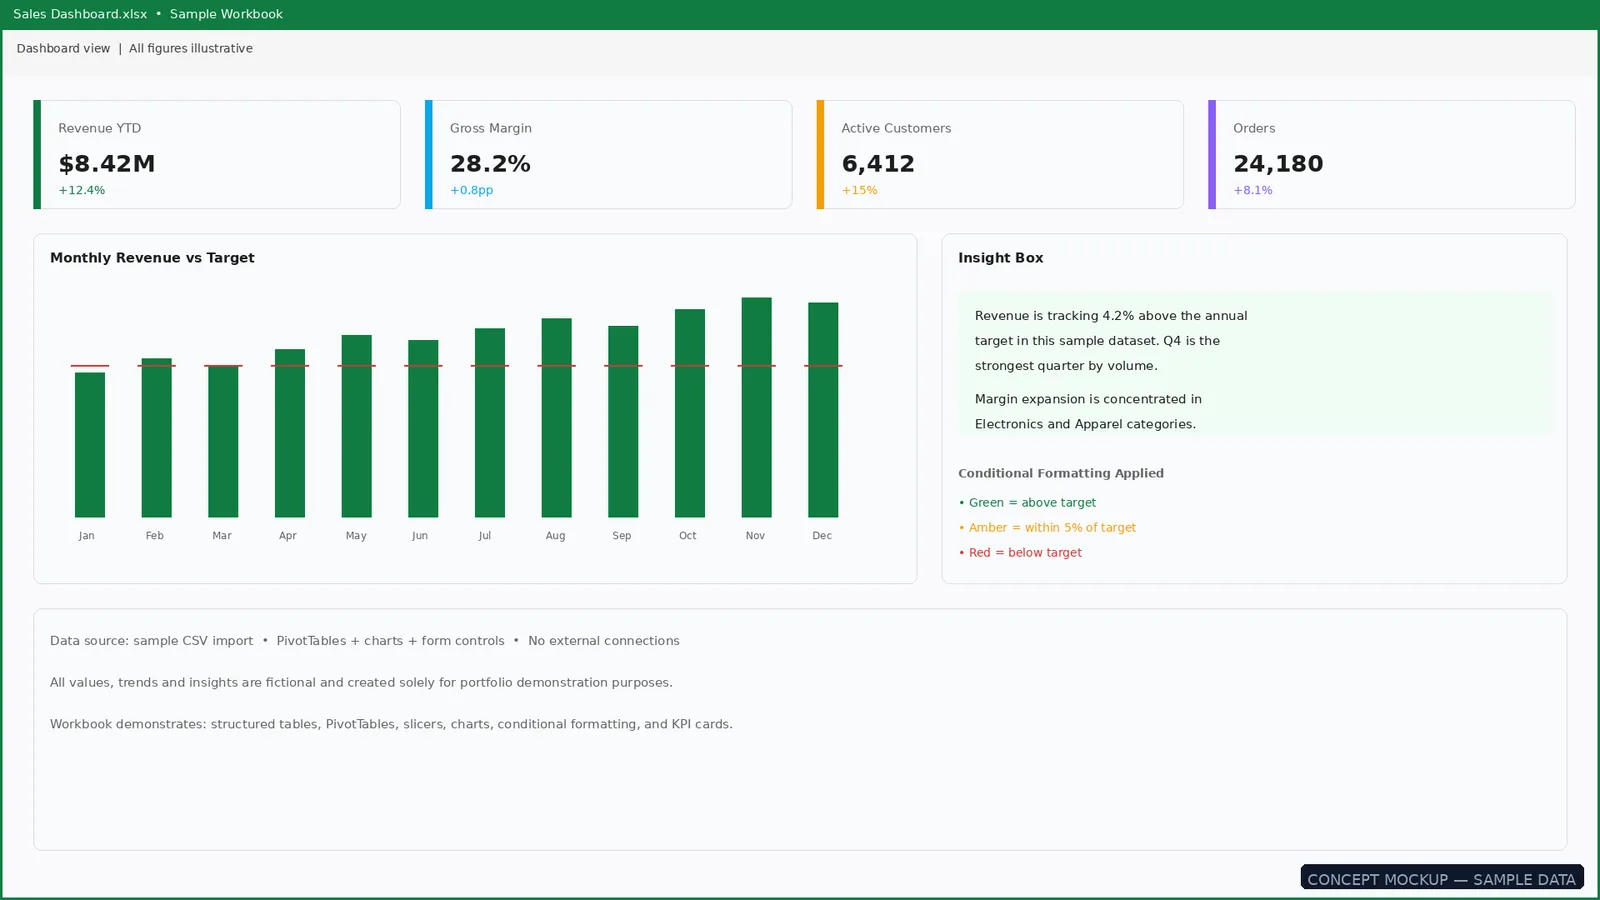
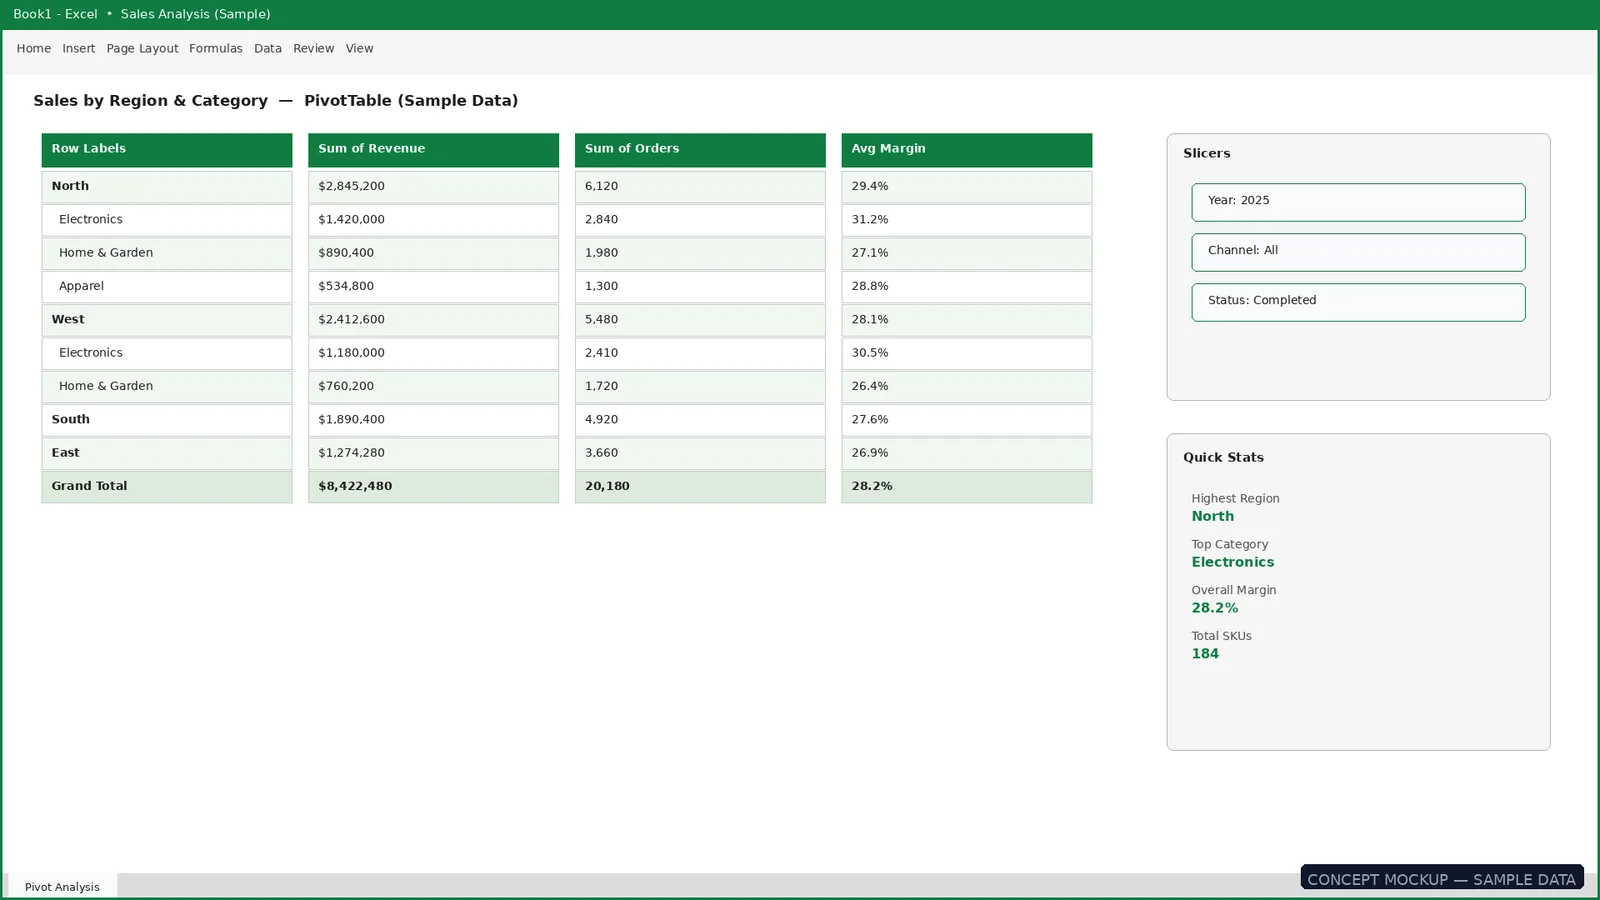
Workbook evidence below includes concept mockups built with sample data. The real project workbook captures are added as they are finalised.
Dataset
Dataset overview
The working dataset holds 800 retail orders in a Kenyan shilling transaction context, with product, category, payment and city detail on every row.
KSh 60.02MRecorded revenue
800Orders
3,313Units sold
KSh 75,028.98Average order value
Objectives
Analytical objectives
- Performance measuresSales revenue, order count, units and average order value.
- Product viewHow products and categories compare.
- Time patternsMonthly sales trends across the dataset.
- SegmentsPayment method and city-level summaries.
Process
Data cleaning & preparation
The Excel work focuses on structuring the raw data first: consistent column types, removed duplicates and prepared analysis sheets before any summary was built.
Tools & project information
- Project type
- Independent analytics project
- Dataset
- 800 retail orders
- Primary tool
- Microsoft Excel
- Note
- Python, SQL and Power BI are not represented here as completed parts of this case study.
The metric values above come from the recorded Excel project summary. Screenshot placeholders are replaced with captures from the actual workbook before publishing.
View the repository
The documented Excel workbook and project files.
Have data that needs this kind of structure?
Discuss a data analysis project